
StochPy Examples
We developed to Demo() module to illustrate the capabilities of StochPy. This Demo() module can be started by using the following commands inside e.g. Python and/or iPython,>>> import stochpy
>>> stochpy.Demo()
We now offer simple and more advanced iPython notebook example scripts which illustrate StochPy in action:
In addition, we show several examples (some more complicated than others) on this website. More advanced examples are also shown to illustrate the power of StochPy and Python.
Basic Examples
- Immigration-death model
- Dimerization model
- Decaying dimerizing model
- Chemical conversion with and without delay
1) Immigration-death model

The immigration-death model contains one molecule, which is synthesized with a constant rate and degraded with a first order reaction based on the copy number of this molecule. Because StochPy is designed to model biological systems, we assume constant syntheses of mRNA molecules and a first order degradation of mRNA molecules. A cell size of 1 was taken for convenience.
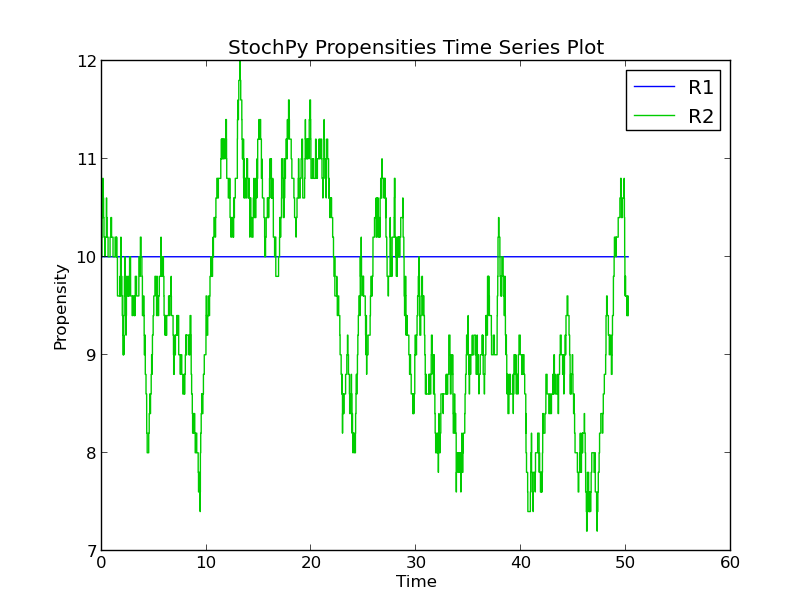
In this example, we start stochpy, create a stochastic module smod, and do a stochastic simulation for the default number of time steps. By using the IsTrackPropensities argument we also track propensities through time. Subsequently, we can plot - besides species time series - also propensities time series data.
>>> import stochpy
>>> smod = stochpy.SSA()
>>> smod.DoStochSim(IsTrackPropensities=True)
>>> smod.PlotSpeciesTimeSeries()
>>> smod.PlotPropensitiesTimeSeries()

In addition, StochPy provides the analyses of e.g. event waiting times and autocorrelations. Simulations with more time steps are done to create more reliable plots.
>>> smod.DoStochSim(end=10**5)
>>> smod.GetSpeciesAutocorrelations()
>>> smod.PlotSpeciesAutocorrelations(nlags=25)
>>> smod.GetWaitingtimes()
>>> smod.PlotWaitingtimesDistributions()
>>> stochpy.plt.xlim([10**-4,10**0])


Finally, 3 trajectories of 3000 time steps are created to illustrate that each trajectory is different (convince yourself by plotting these trajectories with PlotSpeciesTimeSeries). Here, we show that the means and standard deviations for each trajectory is different. Using more time steps will results in smaller differences between trajectory statistics (e.g. mean and standard deviation). StochPy provides the data of the latest simulated trajectory in its memory. Simulation data of different trajectories can be obtained by using GetTrajectoryData().
>>> smod.DoStochSim(trajectories=3,end=3000,mode='steps')  # multiple trajectories
>>> smod.data_stochsim.simulation_trajectory # trajectory number
>>> smod.PrintSpeciesMeans()
Species	Mean
mRNA	51.8141542774
>>> smod.PrintSpeciesStandardDeviations
Species	Standard Deviation
mRNA	5.84373026875
>>> smod.GetTrajectoryData(1) # switch to data from trajectory 1
>>> smod.data_stochsim.simulation_trajectory # trajectory number
>>>smod.PrintSpeciesMeans()
Species	Mean
mRNA	48.9522582086
>>> smod.PrintSpeciesStandardDeviations
Species	Standard Deviation
mRNA	7.13046866298
2) Dimerization Model
(dsmts-003-03.psc)
(dsmts-003-04.psc)

Click here to go back to the top of this page.
We use the dimerization model to illustrate generating multiple trajectories and we show that StochPy supports different types of events. In addition, we illustrate an important difference between deterministic and stochastic rate equations. This model contains two molecules, denoted by P and P2, where two molecules of P are necessary to create the dimer P2. This dimerization reaction can only occur if the copy number of P is at least 2. More specifically, the rate equation must be zero if there is only one P molecule available in the cell. Therefore, we cannot use the deterministic rate equation of this reaction, k*P^2. Rather than using this deterministic rate equation, we use the stochastic rate equation 0.5*k*P*(P-1) that correctly describes this system.
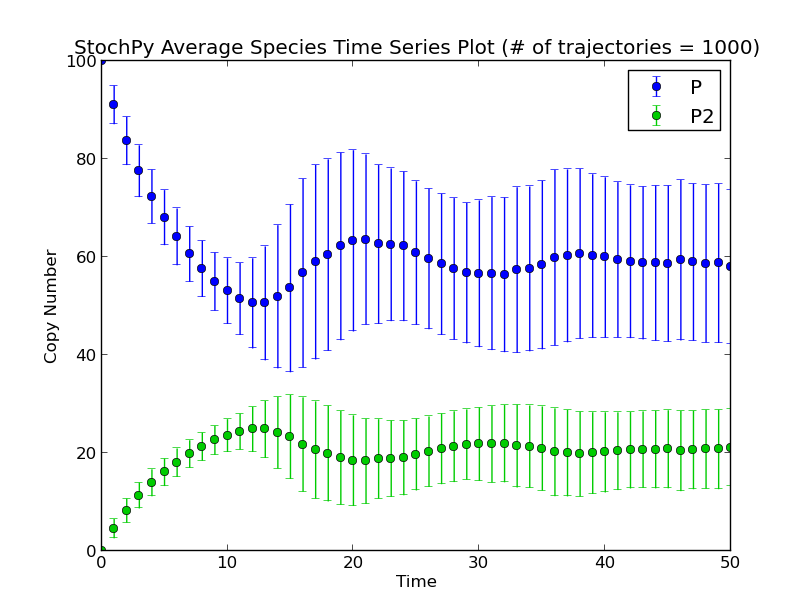
We model two specific examples that incorporate different types of events. Both examples are taken from the stochastic test suite of Evans et al. 2008. We simulated these models until t=50 for 1000 trajectories. Initial copy numbers are P=100 and P2=0. A cell size of 1 was taken for convenience. First, a time event is included where the copy numbers are reset to P = 100 and P2 = 0 if t=>25.
>>> import stochpy
>>> smod = stochpy.SSA()
>>> smod.Model('dsmts-003-03.psc')
>>> smod.DoStochSim(end = 50,mode = 'time',trajectories = 1000)
>>> smod.PlotAverageSpeciesTimeSeries()
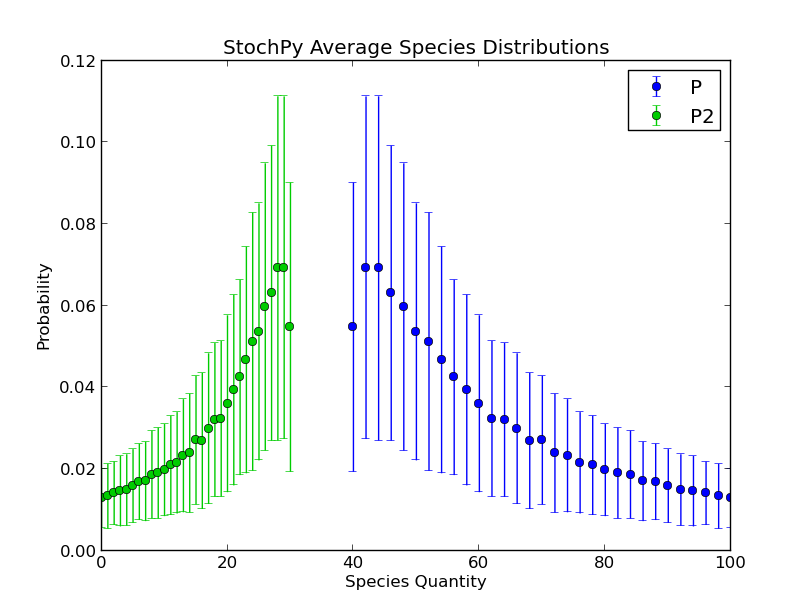
 Secondly, a species amount event was used where the copy numbers are reset to P = 100 and P2 = 0 if the P2 copy number becomes more than 30 in the cell. Besides an average species time series plot, we also illustrate the average distributions of species P and P2. Simulations with more time steps can be done (with less trajectories) to get less variability in these distributions. The resulting distributions of P and P2 may look unexpected. We will explain why the shape of these distributions is correct.
Initially, the copy numbers of P and P2 are 100 and 0. Two molecules of P are necessary to create on P2. The parameters of both reactions drive the P and P2 copy numbers to a steady-state copy number of 27 and 36, respectively. Because in stochastic simulations molecule copy numbers fluctuate around their steady state, one might expect a bell-shaped distribution around P and P2.
The copy number event, however, resets both molecule copy numbers to P = 100 and P2 = 0 if the copy number of P2 becomes more than 30 in the cell. This event explains the the shape of the distributions.
Secondly, a species amount event was used where the copy numbers are reset to P = 100 and P2 = 0 if the P2 copy number becomes more than 30 in the cell. Besides an average species time series plot, we also illustrate the average distributions of species P and P2. Simulations with more time steps can be done (with less trajectories) to get less variability in these distributions. The resulting distributions of P and P2 may look unexpected. We will explain why the shape of these distributions is correct.
Initially, the copy numbers of P and P2 are 100 and 0. Two molecules of P are necessary to create on P2. The parameters of both reactions drive the P and P2 copy numbers to a steady-state copy number of 27 and 36, respectively. Because in stochastic simulations molecule copy numbers fluctuate around their steady state, one might expect a bell-shaped distribution around P and P2.
The copy number event, however, resets both molecule copy numbers to P = 100 and P2 = 0 if the copy number of P2 becomes more than 30 in the cell. This event explains the the shape of the distributions.
>>> import stochpy
>>> smod = stochpy.SSA()
>>> smod.Model('dsmts-003-04.psc')
>>> smod.DoStochSim(end = 50,mode = 'time',trajectories = 1000)
>>> smod.PlotAverageSpeciesTimeSeries()
>>> smod.PlotAverageSpeciesDistributions()
3) Decaying Dimerizing Model
(DecayingDimerizing.psc)

Click here to go back to the top of this page.
StochPy provides different implementations of (in)-exact SSA solvers. By default, the exact direct method is selected. Here, we use the decaying dimerizing model to illustrate the potential advantage of inexact SSA solvers. While exact solvers simulate 1 reaction per time step, inexact solvers such as the tau-leaping method try to simulate >> 1 reaction per time step. As a result, a significant speed advantage can be obtained for models where molecules are present in large quantities. An example of such a system is the decaying-dimerizing model, where S1(t=0)= 100000. Results of simulations done with both the direct method and the tau-leaping method are shown below. Note that information about event waiting times cannot be obtained with this tau-leaping method.
>>> import os,stochpy
>>> smod = stochpy.SSA()
>>> smod.Model('DecayingDimerizing.psc')
>>> smod.DoStochSim(method='TauLeaping',end=50,mode='time')
>>> smod.PlotSpeciesTimeSeries()
>>> smod.DoStochSim(method='Direct',end=50,mode='time')
>>> smod.PlotSpeciesTimeSeries()
>>> stochpy.plt.xscale('log')
>>> smod.PlotWaitingtimesDistributions()


4) Isomerization reaction with and without delay
(Isomerization.psc)

Click here to go back to the top of this page.
StochPy now also provides delayed-SSAs for which a different high-level function is developed. Here, we use a simple two-molecule model to illustrate the concept of delays. First, we perform an exact SSA without delay:
>>> smod.Model('Isomerization.psc')
>>> smod.DoStochSim(mode='time',end=10,trajectories=1000)
>>> smod.GetRegularGrid(n_samples=50)
>>> smod.PlotAverageSpeciesTimeSeries()
Next, we set a delay of 5 time units. Note that StochPy allows two types of delays: consuming and nonconsuming. A consuming delay means that the reaction substrate(s) decrease immediatly and that the reactions products are delayed.
>>> smod.SetDelayParameters({'R1':('fixed',5)})
>>> smod.DoDelayedStochSim(mode='time',end=10,trajectories=1000)
>>> smod.GetRegularGrid(n_samples=50)
>>> smod.PlotAverageSpeciesTimeSeries()
Alternatively, a nonconsuming delay means that both the degradation of reaction substrates and the production of reaction products is delayed.
>>> smod.SetDelayParameters({'R1':('fixed',5)},nonconsuming_reactions=['R1'])
>>> smod.DoDelayedStochSim(mode='time',end=10,trajectories=1000)
>>> smod.GetRegularGrid(n_samples=50)
>>> smod.PlotAverageSpeciesTimeSeries()

Advanced Examples
Click here to go back to the top of this page.Users can exploit the fact that StochPy is written in Python, which we illustrate with more advanced examples. All these examples are hard coded in the StochPy Utilities module, which is available since the 1.0.2 release. In these examples, most plots are created with StochPy high-level functions and subsequently modified to the requirements of the user. As illustrated this can be done with basic Python commands. In future releases, more examples and useful functions built by users of StochPy will be added to the Utils module. Usage of this module is done with the following commands,
>>> import stochpy
>>> utils = stochpy.Utils()
>>> utils.doExample1()
>>> utils.doExample2()
1) Immigration-Death Model
(ImmigrationDeath.psc)
The immigration-death model described before is one of the simplest examples of a Poisson process. A Poisson process is a stochastic process where events occur continuously and independently of one another. The mean and variance of a Poisson process are equal. The default synthesis and degradation rate constants are 10 and 0.2, thus we can easily verify that the mean and variance are both 50 copy numbers per cell. We use StochPy to illustrate this. First, N samples are drawn from a Poisson distribution with Lambda=50. Secondly, a stochastic simulation is done for N time steps. Thirdly, the probability mass function generated from the stochastic simulation is plotted. Finally, a histogram of the randomly generated Poisson data is plotted on top of the probability mass function of the mRNA copy number in the cell.
>>> import stochpy
>>> smod = stochpy.SSA()
>>> import numpy as np
>>> lambda_ = 50
>>> N = 1500000
>>> data = np.random.poisson(lambda_,N)
>>> smod.Model('ImmigrationDeath.psc')  # Ksyn = 10, Kdeg = 0.2, and mRNA(init) = 50
>>> smod.DoStochSim(end=N,mode='steps')
>>> smod.PlotSpeciesDistributions(linestyle= 'solid')
>>> n, bins, patches = stochpy.plt.hist(data-0.5, max(data)-min(data),
 normed=1, facecolor='green')
>>> smod.PrintSpeciesMeans()
mRNA  49.9117062522
>>> smod.PrintSpeciesStandardDeviations()
Species       Standard Deviation
mRNA  7.0730769793

2) Burst Model
(Burstmodel.psc)

The model shown in the figure above describes stochastic single-cell transcription. This transcription can occur in a bursty and non-bursty manner, which depends on the used parameter values. Two different parameter sets (kon = 0.05 per min, koff = 0.05 per min, ksyn = 80 per min, kdeg = 2.5 per min and kon = 5.0 per min, koff = 5.0 per min, ksyn = 80 per min, kdeg = 2.5 per min) are used to demonstrate this model. A cell volume size of 1 was taken for convenience.
Part I: time series plots
First, two "short" time simulations were done to illustrate the behavior of mRNA through time for bursty and non-bursty transcription. High-level functions are used for e.g. performing stochastic simulations, changing parameter values, and basic plotting. StochPy also offers modification of the basic plots by I) arguments in the high-level functions and II) post-plotting modifications. Examples of these post-plotting modifications are e.g. the axis ranges and ticks. Note that most plotting features can be used both as an argument in the StochPy high-level functions and as a post-plotting modification. To illustrate this point, we set axis labels first as an argument and subsequently as a post-plotting modification. HTML color codes were used to plot species with specific colors.
import stochpy
import matplotlib.gridspec as gridspec
sim_end = 100
smod = stochpy.SSA()
smod.Model('Burstmodel.psc')
smod.ChangeParameter("kon",0.05)
smod.ChangeParameter("koff",0.05)
smod.DoStochSim(end=sim_end,mode='time',trajectories = 1)
# Use a nice grid to plot 4 figures
gs = gridspec.GridSpec(4,1,width_ratios=[1],height_ratios=[0.3,1,0.3,1])
ax1 = stochpy.plt.subplot(gs[0])

smod.PlotSpeciesTimeSeries(species2plot ='ONstate',xlabel ='',ylabel ='')
stochpy.plt.legend('',frameon=False) # remove legend
stochpy.plt.xlim([0,sim_end])        # set x lim
stochpy.plt.xticks([])               # remove x ticks
stochpy.plt.ylim([0,1.1])            # set y lim
stochpy.plt.yticks([])               # remove y lim
stochpy.plt.text(-5.5,0.9,'ON')
stochpy.plt.text(-5.5,0,'OFF')
stochpy.plt.text(101,0.35,'A',fontsize = 14)

ax2 = stochpy.plt.subplot(gs[1])
smod.plot.ResetPlotnum()
smod.PlotSpeciesTimeSeries(species2plot ='mRNA',colors = ['#32CD32'])
stochpy.plt.xlim([0,sim_end])
stochpy.plt.legend('',frameon=False)
stochpy.plt.xticks([])
stochpy.plt.title('')
stochpy.plt.xlabel('')
stochpy.plt.ylabel('mRNA')
stochpy.plt.yticks([0,20,40,60])
stochpy.plt.text(101,27,'B',fontsize = 14)

smod.ChangeParameter("kon",5.0)
smod.ChangeParameter("koff",5.0)
ax3 = stochpy.plt.subplot(gs[2])
smod.plot.ResetPlotnum()
smod.DoStochSim(end=sim_end,mode='time')
smod.PlotSpeciesTimeSeries(species2plot ='ONstate',xlabel ='',ylabel ='')
stochpy.plt.title('')
stochpy.plt.legend('',frameon=False)
stochpy.plt.xlim([0,sim_end])
stochpy.plt.xticks([])
stochpy.plt.ylim([0,1.1])
stochpy.plt.yticks([])
stochpy.plt.text(-5.5,0.9,'ON')
stochpy.plt.text(-5.5,0,'OFF')
stochpy.plt.text(101,0.35,'C',fontsize = 14)

ax4 = stochpy.plt.subplot(gs[3])
smod.plot.ResetPlotnum()
smod.PlotSpeciesTimeSeries(species2plot ='mRNA',colors = ['r'])
stochpy.plt.xlim([0,sim_end])
stochpy.plt.legend('',frameon=False)
stochpy.plt.xticks([])
stochpy.plt.title('')
stochpy.plt.ylabel('mRNA')
stochpy.plt.yticks([0,20,40,60])
stochpy.plt.text(101,27,'D',fontsize = 14)
stochpy.plt.savefig('stochpy_test.pdf')

Part II - Distributions
The mean copy number of mRNA in the cell is identical for bursty and non-bursty transcription, but the mRNA copy number distribution is completely different. For the first parameter values set, the mRNA copy number is bimodal distributed. In contrast, the mRNA copy number is unimodal distributed for the second parameter values set. Therefore, the standard deviation of the mRNA copy number is different.
The distributions of mRNA copy numbers and mRNA synthesis event waiting times are analytically known. These analytical solutions depend only on the model parameters. We made two Python functions that can be used to determine these distributions. Here, we show that the StochPy solutions are in agreement with the analytical outcomes. Note that these simulations are significantly more time consuming than the previous simulations. For running this example, one can simple copy the code into a script and/or simply use the %paste command in iPython.
import numpy as np,os,mpmath,stochpy
mpmath.mp.pretty = True

def GetAnalyticalPDF(kon,koff,kdeg,ksyn):
    """
    Get the analytical probability density function.
    The analytical solution is taken from Sharezaei and Swain 2008
    - Analytical distributions for stochastic gene expression
    """
    x_values = np.linspace(0,50,10000)
    y_values = []
    for m in x_values:
        a = ((ksyn/kdeg)**m)*np.exp(-ksyn/kdeg)/mpmath.factorial(m)
        b = mpmath.mp.gamma((kon/kdeg)+m) * mpmath.mp.gamma(kon/kdeg + koff/kdeg)\
            /(mpmath.mp.gamma(kon/kdeg + koff/kdeg + m)* mpmath.mp.gamma(kon/kdeg))
        c = mpmath.mp.hyp1f1(koff/kdeg,kon/kdeg + koff/kdeg + m,ksyn/kdeg)
        y_values.append(a*b*c)
    return x_values,y_values

def GetAnalyticalWaitingtimes(kon,koff,ksyn):
    """ Get analytical waiting times """
    A = mpmath.sqrt(-4*ksyn*kon+(koff + kon + ksyn)**2)
    x = []
    for i in np.linspace(-20,5,5000):
        x.append(mpmath.exp(i))
    y = []
    for t in x:
        B = koff + ksyn - (mpmath.exp(t*A)*(koff+ksyn-kon))-kon+A+ mpmath.exp(t*A)*A
        p01diff = mpmath.exp(-0.5*t*(koff + kon + ksyn+A))*B/(2.0*A)
        y.append(p01diff*ksyn)
    return (x,y)

smod = stochpy.SSA(File='Burstmodel.psc')
ntimesteps = 1000000
### First parameter set ###
smod.ChangeParameter("kon",0.05)
smod.ChangeParameter("koff",0.05)
smod.DoStochSim(end=ntimesteps,mode='steps')
smod.PlotSpeciesDistributions(species2plot = 'mRNA'
                              ,colors=['#32CD32'],linestyle= 'solid')
smod.PlotWaitingtimesDistributions('R3', colors=['#32CD32']
                                   ,linestyle = 'None',marker='o')

### Second parameter set ###
smod.ChangeParameter("kon",5.0)
smod.ChangeParameter("koff",5.0)
smod.DoStochSim(end=ntimesteps,mode='steps')
smod.plot.plotnum = 1
smod.PlotSpeciesDistributions(species2plot = 'mRNA', colors=['r'],linestyle='solid')
#### Add analytical solution with first parameter set to the plot ###
x,y = GetAnalyticalPDF(kon=0.05,koff=0.05,kdeg=2.5,ksyn=80.0)
stochpy.plt.step(x,y,color ='k')
#### Add analytical solution with the 2nd parameter set to the plot ###
x,y = GetAnalyticalPDF(kon=5.0,koff=5.0,kdeg=2.5,ksyn=80.0)
stochpy.plt.step(x,y,color ='k')
stochpy.plt.xlabel('mRNA copy number per cell')
stochpy.plt.ylabel('Probability mass')
stochpy.plt.legend(['Bimodal','Unimodal', 'Analytical solution']
                   ,numpoints=1,frameon=False)
stochpy.plt.title('')
stochpy.plt.ylim([0,0.045])

### Finish waiting times plot ###
smod.PlotWaitingtimesDistributions('R3', colors=['r'],linestyle = 'None',marker='v')
(x,y) = GetAnalyticalWaitingtimes(kon=0.05,koff=0.05,ksyn=80.0)
stochpy.plt.plot(x,y,color ='k')
(x,y) = GetAnalyticalWaitingtimes(kon=5.0,koff=5.0,ksyn=80.0)
stochpy.plt.plot(x,y,color ='k')
stochpy.plt.xlabel('Time between RNA synthesis events')
stochpy.plt.ylabel('Probability density')
stochpy.plt.legend(['Bimodal','Unimodal', 'Analytical solution'],numpoints=1
                   ,frameon=False,loc='lower left')
stochpy.plt.title('')
stochpy.plt.xlim([10**-7,10**3])
stochpy.plt.ylim([10**-9,10**3])


3) Protein Synthesis Model
(celldivision_explicit.psc)

Since StochPy 2.0 we offer a specific module (see e.g. the cell division iPython notebook) that allows for the simulation of a cell lineage. The simulation of a cell lineage means that one has to do a sequential simulation. That is, a simulation where the next generation starts with the results of the previous simulation. Within generations, the cell has to divide his content between two daughters; one of them we track through time.
Here, we illustrate the concept of doing such a simulations with the normal stochastic simulation module within StochPy. We use a network (illustrated in the above figure) that consists, besides mRNA and protein turnover, of active and inactive transcription factors. These transcription factors switch between an inactive and an active state where the active state stimulates mRNA synthesis. Protein synthesis, subsequently, can occur if mRNA is present in the cell. One reaction is not described by mass-action kinetics which makes it for many simulators more complicated to correctly read and simulate. In addition, we want to model cell division. We determine the occurrence of cell division events by a gamma-distribution where the cell content (transcription factors, mRNAs, and proteins) is binomially distributed between two daughter cells during cell division. Subsequently, we track one daughter cell after each cell division. A cell volume size of 1 was taken for convenience.
"""
Interactive modeling session (iPython) with StochPy
for performing sequential simulations
"""

def doSequentialSim(smod,n_generations,cell_division_times):
    for i in range(1,n_generations):
        ### divide each species between two daughter cells ###
        for j in range(0,len(smod.data_stochsim.species_labels)):
            species_amount = smod.SSA.sim_output[-2][1:][j]
            if species_amount:
                smod.settings.X_matrix[j] = np.random.binomial(n=species_amount
                                                               ,p=0.5,size=1)
        ### replace last time point with species amounts after division ###
        species_after_division = copy.deepcopy(list(smod.settings.X_matrix))
        species_after_division.insert(0,cell_division_times[0:i].sum())
        species_after_division.append(np.NAN) # no reaction occurred at cell division
        smod.SSA.sim_output[-1] = copy.deepcopy(species_after_division)
        ### Set settings for new simulation and simulate the next generation ###
        smod.settings.starttime = copy.deepcopy(smod.SSA.sim_output[-1][0])
        smod.settings.endtime = smod.settings.starttime + cell_division_times[i]
        smod.SSA.Execute(smod.settings,False) # do stochastic simulation
    smod.FillDataStochsim() # add all data to data_stochsim object

import stochpy, numpy as np,copy,os,matplotlib.gridspec as gridspec
smod = stochpy.SSA(File='celldivision_explicit.psc',dir=os.getcwd())
T_GENERATION = 60

### 1: Do short simulations for a time series plot ###
N_GENERATIONS = 10
CELL_DIVISION_TIMES = abs(np.random.gamma(T_GENERATION,1,size=N_GENERATIONS))
smod.DoStochSim(end=CELL_DIVISION_TIMES[0],mode='time',trajectories=1)
doSequentialSim(smod,N_GENERATIONS,CELL_DIVISION_TIMES)
smod.PlotSpeciesTimeSeries(species2plot=['Protein'])

### 2: Do long simulation for probability density function of protein copy numbers ###
N_GENERATIONS = 2500
CELL_DIVISION_TIMES = abs(np.random.gamma(T_GENERATION,1,size=N_GENERATIONS))
smod.DoStochSim(end=CELL_DIVISION_TIMES[0],mode='time',trajectories=1)
doSequentialSim(smod,N_GENERATIONS,CELL_DIVISION_TIMES)
smod.PlotSpeciesDistributions(species2plot='Protein',colors =  ['red'])


